TL;DR:
- I created a simple tool to download the apache logs of a web-hosting OVH account available on github.
- I analyzed the logs of my low-traffic blog to reveal a more accurate count of total readers.
As of 2023, this blog is hosted on a OVH web-hosting instance. This comes with simple analytics tools, which aren’t really satisfying: they do not successfully filter out all bot noise, and bogus malicious queries tend to drown out legitimate user traffic. Moreover, I do not use any JS analytics engine, as I want to keep this mostly tracking-free. As a result, it’s impossible to currently evaluate the readership, especially in a very low-volume website such as this one.
Because of this, I was drawn to taking a look at the raw Apache logs, and try to build a quick ad-hoc filter to get a more realistic estimate of the readership. This article is the result of this attempt.
OVH apache logs
OVH allows direct access to the hosting logs via its web interface. While this is a good starting point, there is no batch option - and there’s no way I’m manually triggering hundreds of downloads.
Fortunately, it’s easy to automate. A quick search didn’t reveal existing tooling for this specific use case, so let’s build our own.
The URL for a daily log looks like this:
https://logs.clusterXXX.hosting.ovh.net/partiallogin.clusterXXX.hosting.ovh.net/logs/logs-08-2023/partiallogin.clusterXXX.hosting.ovh.net-26-08-2023.log.gz
The partiallogin appears to be similar to the FTP username, while clusterXXX is probably a physical instance somewhere. It’s apparently the only two parameters to locate the logs, along with the current date.
On the other hand, the current day’s partial log is not compressed and is stored in a different location:
https://logs.clusterXXX.hosting.ovh.net/partiallogin.clusterXXX.hosting.ovh.net/osl/partiallogin.clusterXXX.hosting.ovh.net-27-08-2023.log
Finally, these URLs are protected behind a Basic HTTP auth. When using the web interface the mechanism is unclear - it seems like accessing the log site will generate a temporary access credential? In any case, the Web UI gives us the option to create a specific account for log viewing - this is a more secure way to access these.
I started experimenting in python, but in the end decided it would be a good way to start using some rust again and properly publish a tool others might genuinly find useful. The repo is available on github.
Using existing tools
There are multiple tools that we can feed these logs into. I tried two of them:
Both provide a nice view into the daily activity and various reports, but it was obvious the noise from bots was still drowning actual user traffic, and I couldn’t trust the total visitor count to be an actual human count. Moreover, I couldn’t easily select a user session to verify it, follow it, see which pages were accessed, etc.
Custom report
Instead I started filtering the logs manually. Removing most of the noise from bots is not too hard, as their user agent is pretty explicit. I assume the tools mentionned above do so as well.
bots_keys = ["bot", "spider", "crawler", "dataprovider", "anthropic-ai", "googleother",
             "nbertaupete95", "github-camo", "facebookexternalhit"]
Now, most of the noise came from multiple sources, mainly:
- Obviously malicious queries such as queries ending in
?variables=complexquery. These usually end up as 404, so they’re pretty easy to filter - Regular accesses to
feed.xmlget a special mention - those get counted separately to figure out the RSS readers - Access to key files, that tools or websites are likely to do themselves:
sitemap.xml, favicons, the avatar,.mapfiles, this kind of things. - Accesses with, surprisingly, an empty User Agent.
Moreover, strangely I had to ignore visitors doing only a single queries - I’ve seen what I assume are bots (but which don’t advertise themselves as such) slowly but surely scraping the site, one query after another, using different IPs, in the span of days. Very strange.
Finally, I found that quite a few visits did query the links from the main page but not their resources (article’s images, etc.). I’m not sure what this is but I suspect browsers preemptively query urls in various situations, so I don’t count them as a proper human visit either.
Final results
Once this is all filtered out, I can:
- Look at the human-readable results and monitor individual visits to the website
- Pipe the filtered raw results into one of the tools above, and actually get meaningful reports:
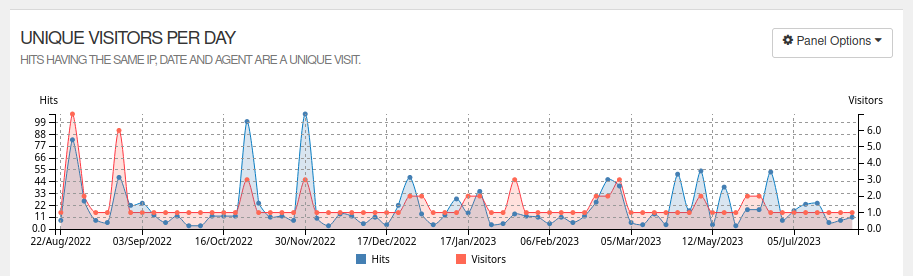
It seems we’ve had about 100 readers so far. This sounds way more reasonable than the ~700 generally reported by GoAccess and others, even when ignoring bots crawlers as much as possible.
Note: if you’re curious you can find the resulting notebook (in a .py form) here but be warned that it is very bespoke to this site, and probably not very reusable.